The Decline of Save Percentages and Its Relationship With Shots and Goals
It is no secret that goaltending has gotten better over time, with the most notable shift coming in the mid-late 1990s when compared to the high scoring 1980s. Goaltending evolved drastically in part due to bigger and better equipment, but also due to superior goaltending practices such as the butterfly style entering the game more regularly. As a result, the average save percentage of all goaltenders increased. However, in recent years, save percentage has started to decline at a noticeable rate.
Note: 2025 Values are based on statistics as of January 27, 2025, and both Save % and Goals/GP exclude empty net goals
As seen by the above graph, save percentage consistently climbed, with the largest jump being from 1992-1993 to 1993-1994. Part of the consistent increase in the 1990s and into the 2000s is related to the introduction of the “dead puck era”, where certain rules of the game led to a style of play that led to fewer scoring chances, making it easier for goalies to make saves on chances that are generally less dangerous. Some of these rules included the allowance of the “clutch and grab”, which would classify as a holding or interference penalty in the modern NHL, the absence of a trapezoid, allowing goalies to play the puck anywhere behind the net, and the two-line pass rule, which prevented the puck from being passed to a teammate if it crossed over the defensive blue line to a teammate past the red line.
As you might notice on the above graph, there is a data point missing in 2005. Most hockey fans would be quick to point out that 2004-2005 was cancelled due to a lockout, however, what might seem less obvious is why there was such a drastic drop in save percentage when the NHL resumed play in 2005-2006. This is in large part due to the elimination of all of the above rules, where you can no longer clutch and grab, the trapezoid was invented so that goalies could not play the puck in the corner, and the two-line pass rule was eliminated. There were many other changes to the league, most notably the reduction in goalie equipment by 11%. Many of these rule changes were specifically made with the goal in mind to increase scoring in the NHL and make the game more exciting.
Save percentage began to increase again as players and goaltenders learned to adjust to the new rules and equipment. However, what was perhaps unexpected was when league-wide save percentage hit a new high in the modern era in 2010-2011, averaging a .913 save percentage, more than the previous high of .911 in 2003-2004. Although teams naturally adjusting to the new rules and locking down defensively can partly explain this increase from 2005-2006, the small difference may also be due to the sheer talent of goaltending in the 2010-2011 season. Some of the starting goaltenders included the likes of Carey Price, Henrik Lundqvist, Marc-Andre Fleury, Pekka Rinne, Roberto Luongo, and Tim Thomas during the best season of his career.
Top 10 Save % Leaders in 2010-2011, Minimum 15 Games Played
The goaltending talent continued to increase in the 2010s as the likes of Braden Holtby, Corey Crawford, and Sergei Bobrovsky continued to develop, and as a result save percentage only got better, peaking at .915 in the 2014-2015 and 2015-2016 seasons. However, since 2015-2016, save percentage has declined every season, with the current average save percentage of .901 being tied with 2005-2006 for the lowest since the 1995-1996 season. However, only in recent years have we started to observe a bizarre trend, that is, the average goals per game is following the same trend as save percentage, a trend that, as seen by the above graph, has almost always been an inverse relationship of the save percentage graph until the last two seasons. The inverse trend made sense, because one would assume less percentage of shots saved automatically equals more goals. However, clearly something has happened in the past two seasons to change this.
The most concrete explanation would be that there are fewer shots on goal than previous seasons, which is likely the case, but unfortunately, this is difficult to prove due to how shot keeping has changed over the years, becoming more accurate in recent years. But outside of the number of shots, there are a few explanations as to why these trends of decreasing save percentage and decreasing goals scored are occurring simultaneously.
The first explanation one could come to is that the goaltending talent is simply not as high today as it was in the 2010s. However, this alone is likely not a significant enough reason to explain a .010+ average save percentage difference, with goaltenders today theoretically receiving the best training and information we have ever had. Instead, it is more than likely that goaltender statistics are down because of the way the overall game has changed, not the other way around, where the game is changing because goaltenders aren’t as skilled.
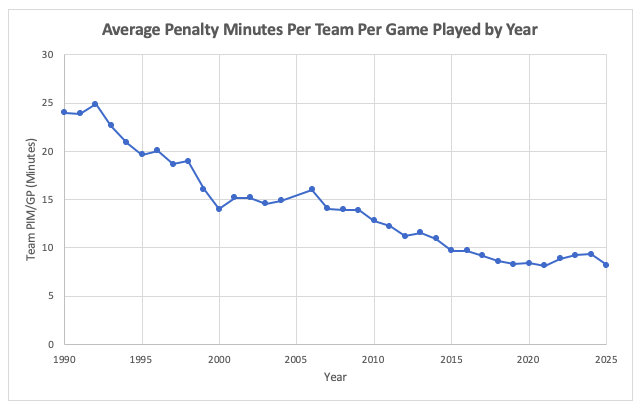
So in what way has the game changed over the past 10 seasons that would be reflected in the goaltending and scoring stats? One key difference between hockey today and hockey 10-20+ years ago is the skill level. This is not to say the old NHL wasn’t also skilled, but with a shift away from the physical part of the game, in part due to stricter rules after the end of the dead puck era, the development of young players today has a much larger emphasis on the skill aspect of the game. Unfortunately, this is difficult to visibly show due to the hits statistic being recorded using an unreliable method, however, the sheer decrease in penalty minutes each year inadvertently showcases a decrease in fighting majors and general penalties that would be caused by physicality, such as boarding or charging penalties.
Decrease in PIM over time correlates with a less physical style of game played
An increase in average player skill would imply better passes, more accurate shots, better skating skills, etc, all factors that may lead to players getting better, and making it more difficult for goaltenders to make saves compared to before.
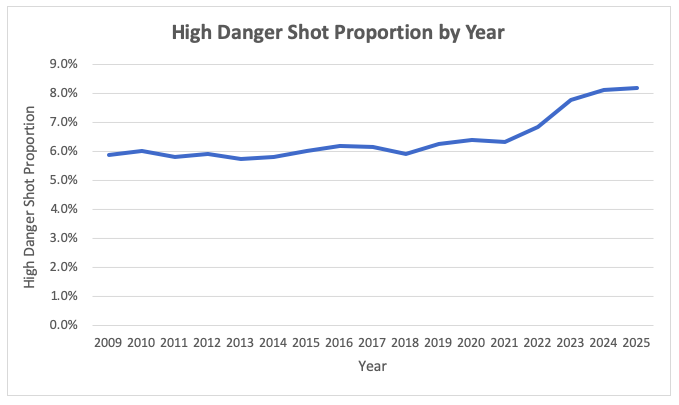
While the development of younger players is shifting to a more skill focused style of play, current players are also shifting as analytics have evolved. Players are now more aware of optimal shot selection, weaknesses of opposing goaltenders, etc. One example of this is the increase in the proportion of shots taken that are high danger versus low danger or medium danger. These statistics are based on the advanced statistics website MoneyPuck.com, where they define a low danger shot as a shot with a less than 8% expected goal value, a medium danger shot as a shot with an expected goal value between 8% and 20%, and a high danger shot as a shot with an expected goal value above 20%.
Percentage of shots that are high danger are generally increasing each year
The proportion of shots being high danger versus low or medium danger has jumped by a 0.023 proportion since 2008-2009, jumping from 5.9% to 8.2%, which is a 38.8% increase. This points towards a higher and more selective quality of shots, where players may be hesitant to take low percentage shots, and instead look for openings to create a high danger shot, and thus a better scoring chance. This simultaneously means that the difficulty of shots goaltenders now face have increased due to a higher proportion of high quality shots. However, the explanation as to why average goals have gone down over the past two seasons may be a bit more complicated and without a clear answer. One narrative is that players are becoming “too optimal” and passing up shots that they may have taken in the past, some of which they may have scored anyway. Another theory is that teams are now adjusting to more defensive strategies and playing more “trap-based” styles of hockey to reduce scoring chances. Finally, it may just simply be a coincidence, and that the difference in average goals/game played from this year to three and two seasons ago is not large enough for there to be a significant difference in the way the game is played.
After analyzing various factors, it is clear that the biggest change in save percentage revolves around goaltending equipment and knowledge, as seen by the massive spike in the mid-1990s. However, after that evolution, changes in save percentage and average goals became more subtle, as these changes became more dependent on evolution in the way the game is played outside of the goaltenders, such as shot selection and shot quality and a shift from a physically-focused game to a skill-focused game.


